The Keeper Reveal
How to Read and Compare Phenotype Radar Charts
A radar chart turns a season of scores into a shape you can read in seconds. Here is how to use one to spot your keeper and the trade-offs between phenos.
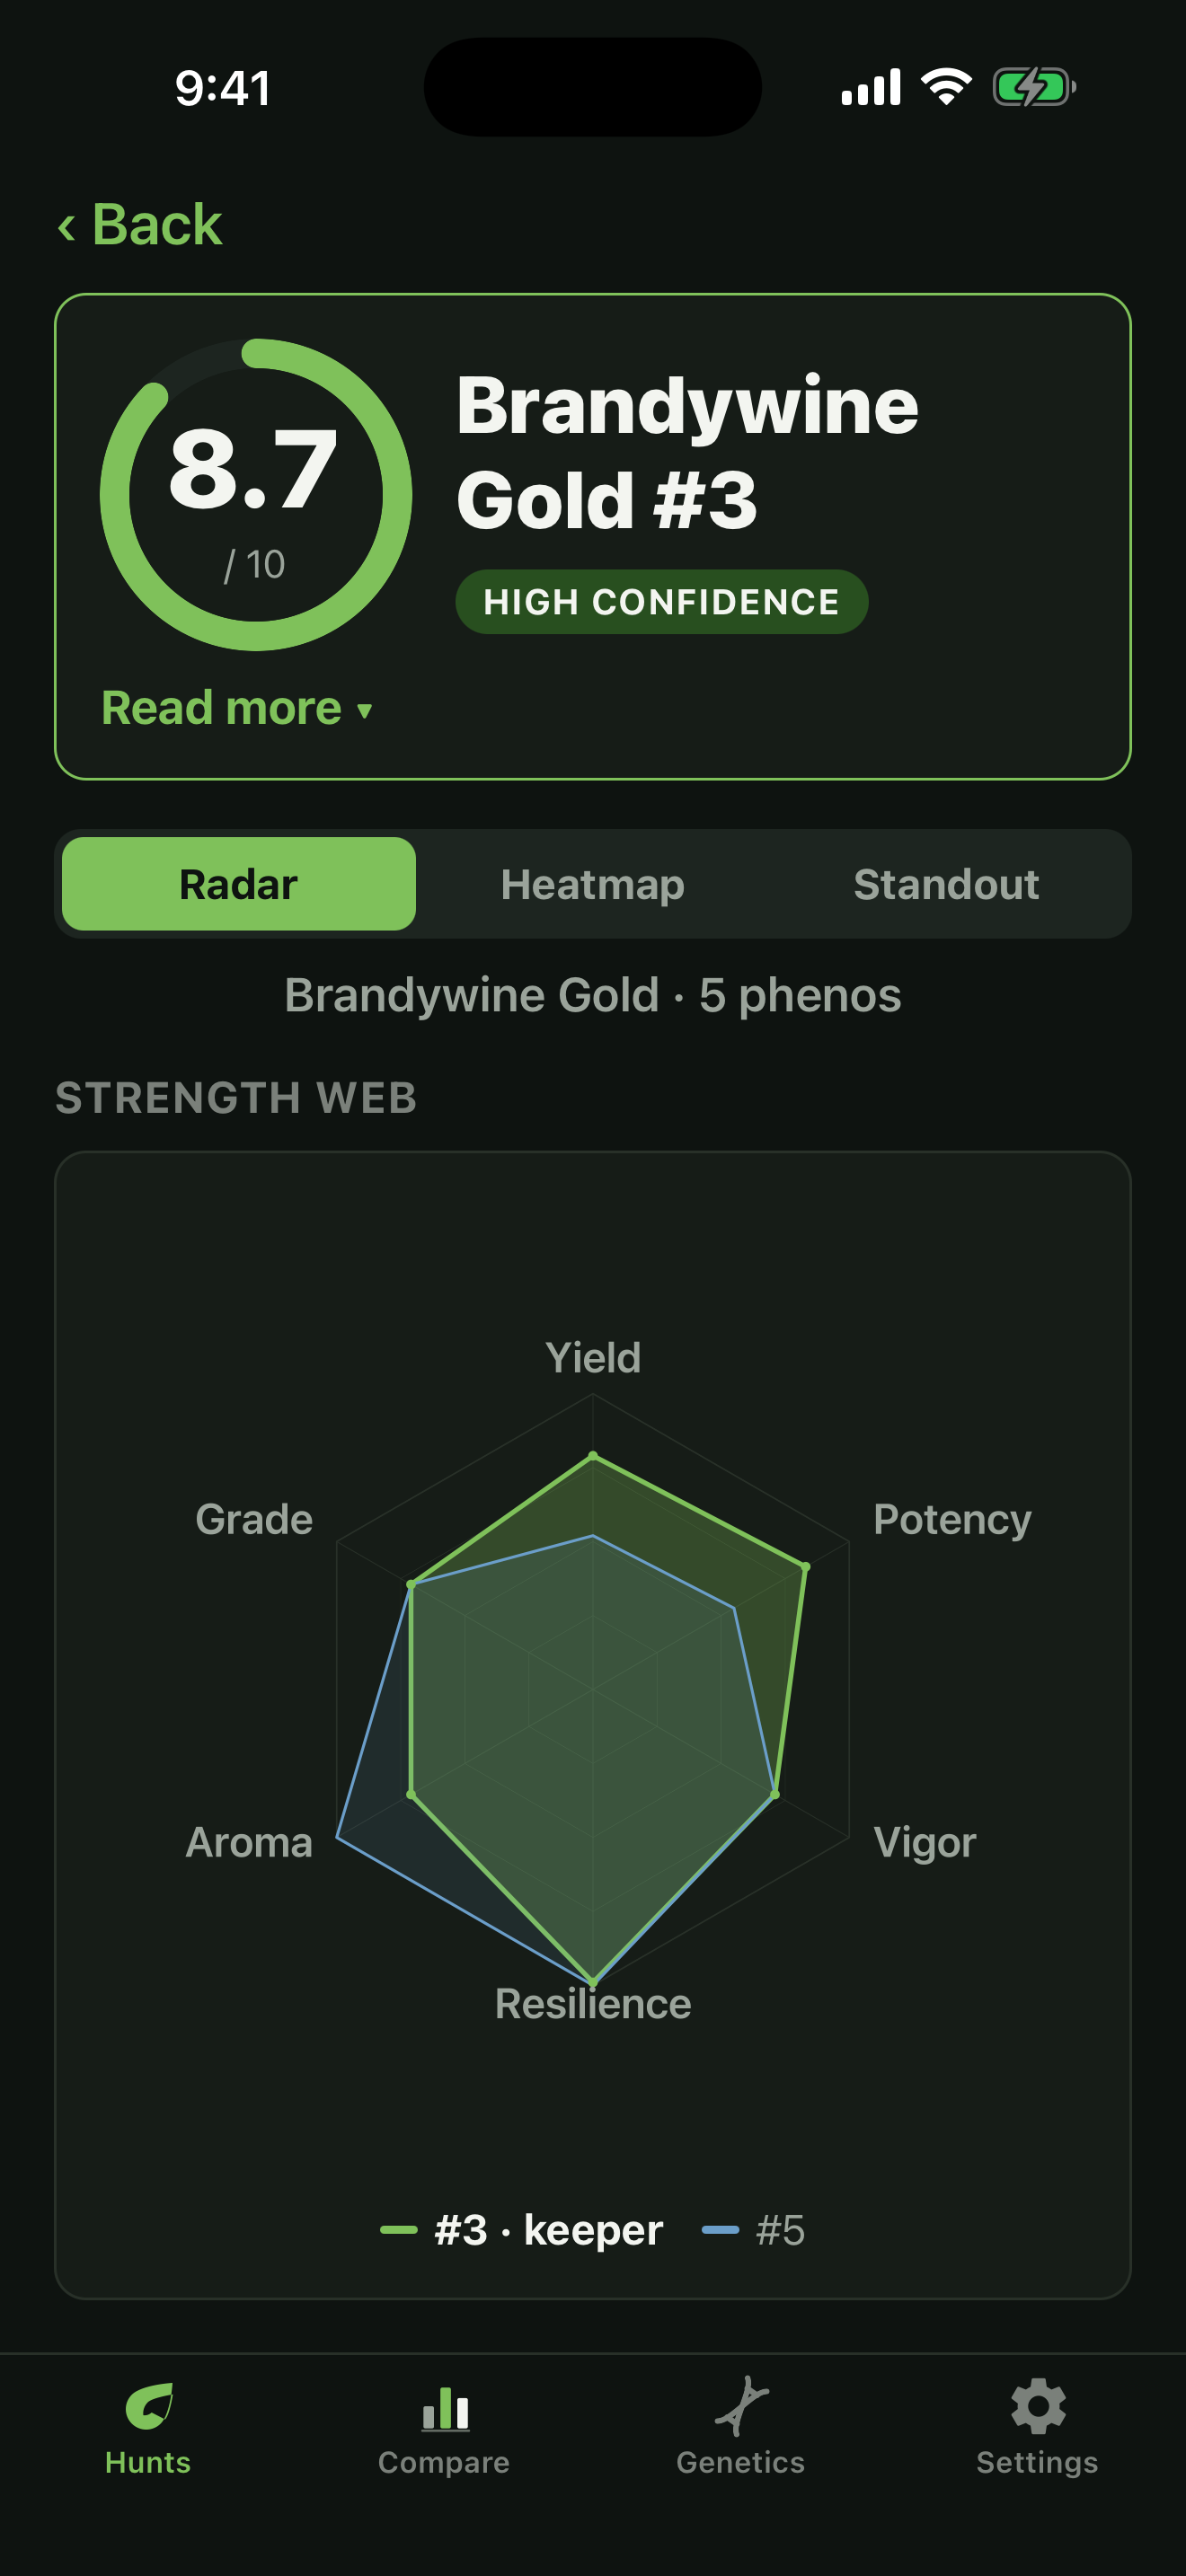
A column of numbers hides the thing you actually want to know. Two phenos can have the same average score and be completely different plants, one balanced across every trait, the other carried by a single standout strength. A radar chart shows you that difference at a glance, which is why it is the fastest way to read a pheno hunt.
A radar chart, sometimes called a spider chart or a strength web, plots several traits at once around a single shape. Each spoke is a trait. The further a point sits from the center, the higher the score on that trait. Connect the points and you get a shape, and that shape is the plant’s personality.
Reading a single phenotype
Start with one plant. In PhenoLog the Strength web lays a pheno’s scores across all six traits, yield, potency, vigor, resilience, aroma, and grade, as a single filled shape, with the composite score out of ten and a confidence level right at the top.
A quick note on where these views live. The Strength web, the Hunt scorecard, and the standout lanes are the AI Keeper analysis, which is part of the Pro plan. If you are not on Pro, the free Compare screen still lines phenos up side by side with their composite scores and trait breakdowns. The charts below are the AI Keeper views.
Two things to look for. First, size. A bigger overall footprint means higher scores across the board. Second, shape. A round, even shape is a well-rounded plant. A spiky shape that stretches far on one or two spokes and collapses on the rest is a specialist, strong somewhere specific and weak elsewhere. Neither is automatically better. It depends on what you are hunting for.
Comparing two phenotypes head to head
The chart earns its keep when you overlay two plants. Below the web sits the composite ranking. Tap any pheno there and it drops onto the chart as a second shape, so you can read the trade-off between the two instantly, where one pulls ahead and where it gives ground.
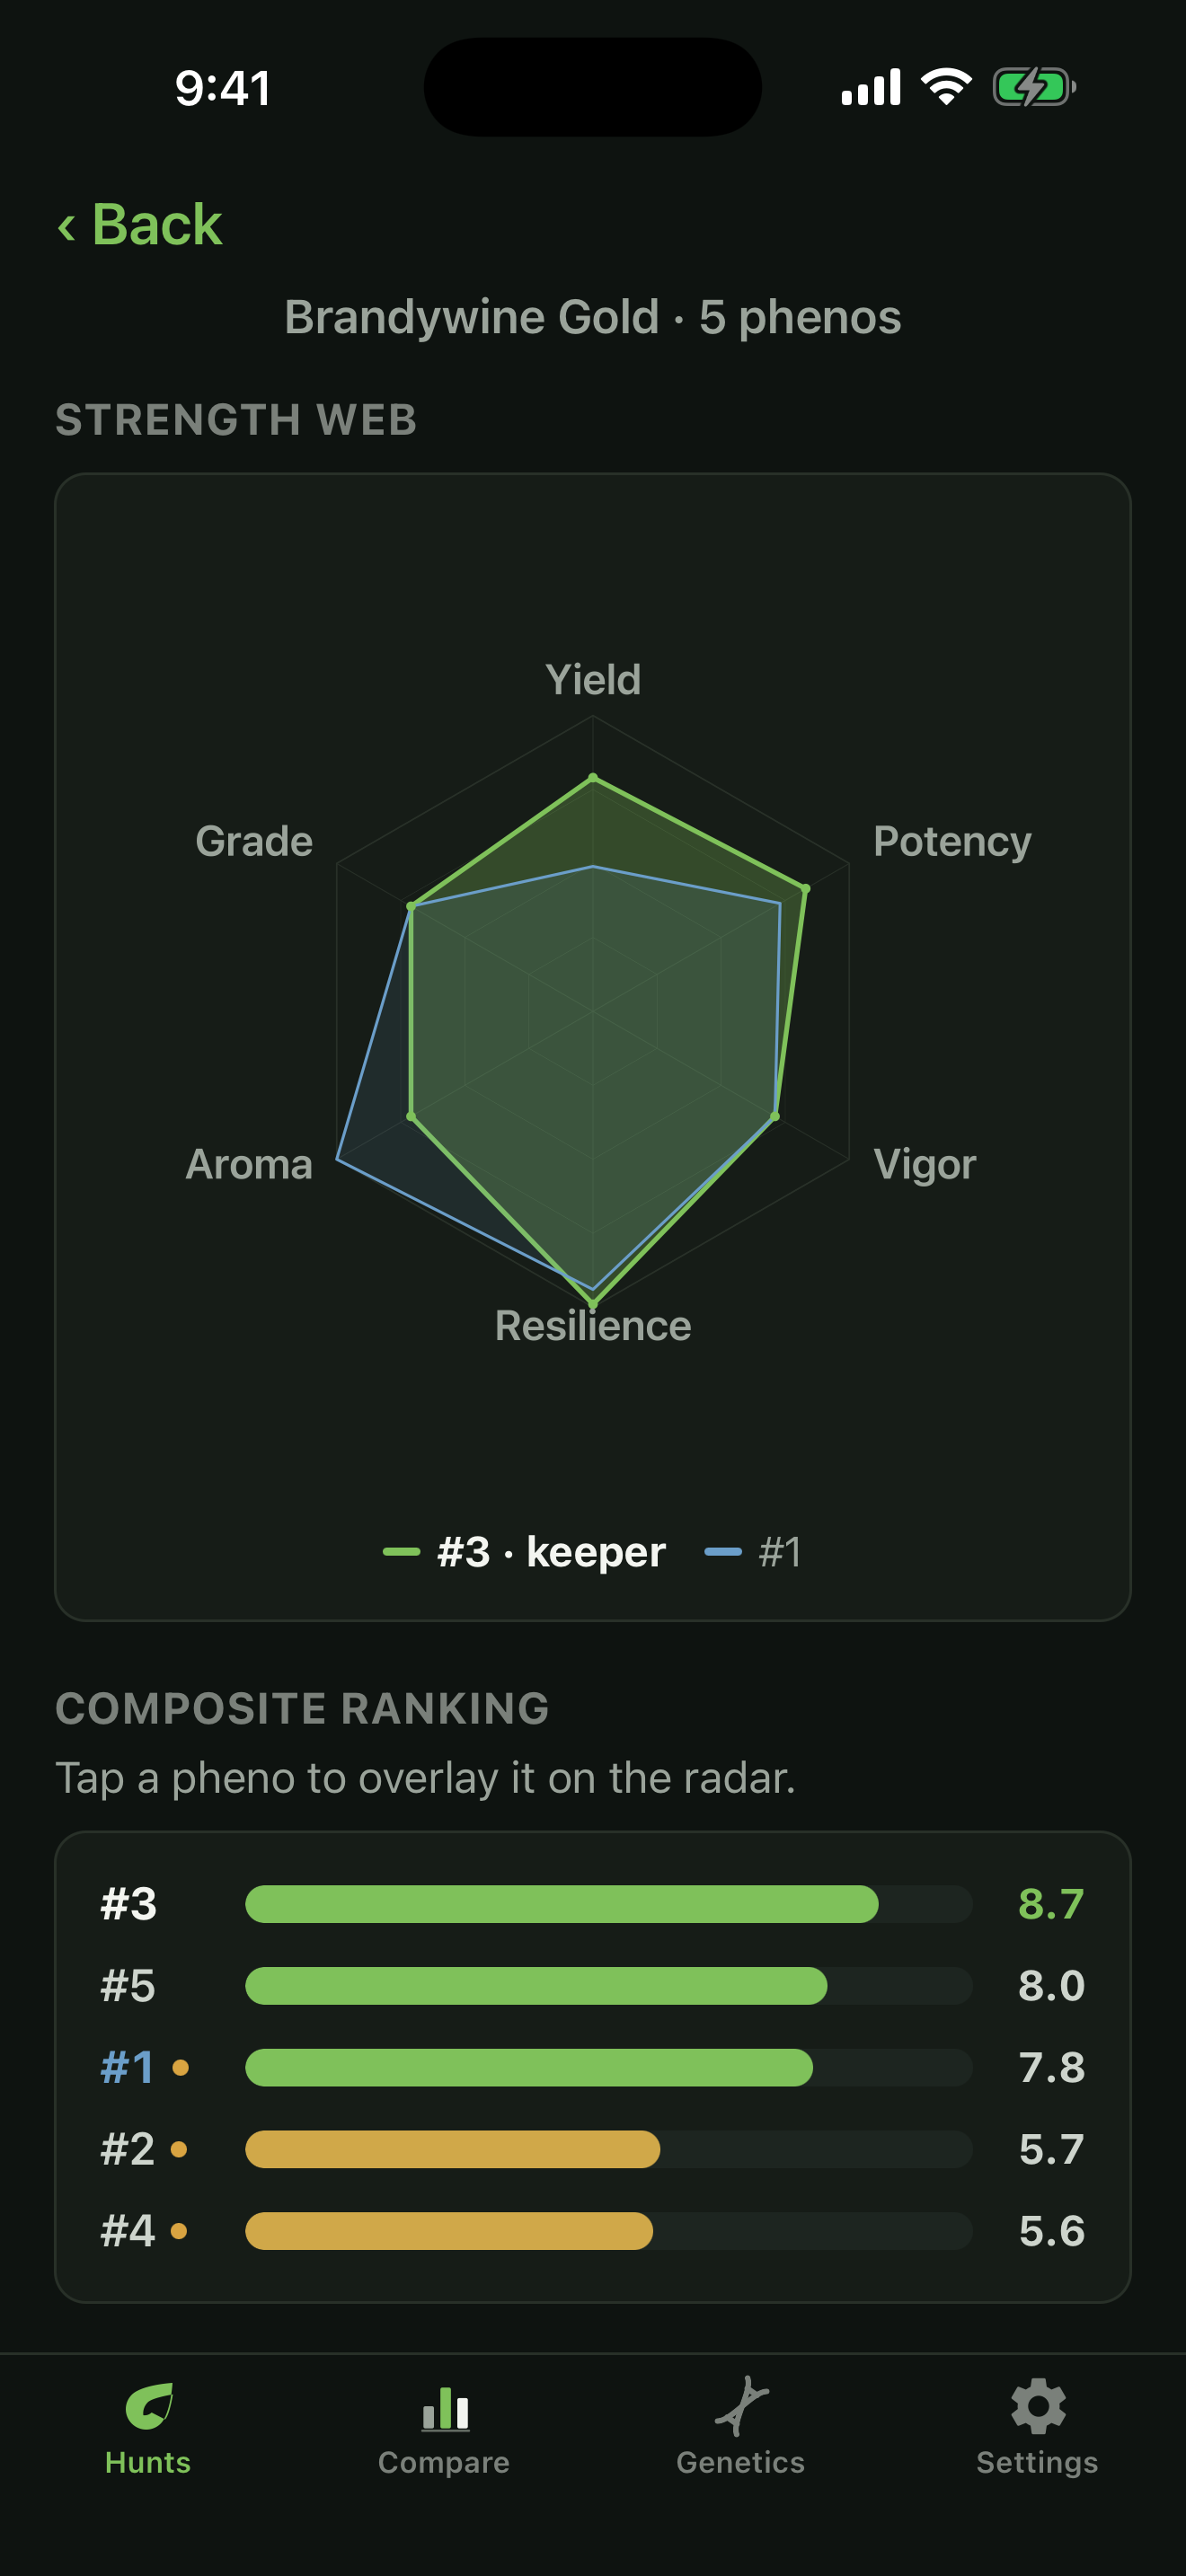
Take a five-pheno hunt of Brandywine Gold. Put #3 and #5 on the web together. The green shape, #3, reaches further on yield and resilience and holds a strong, even spread. The blue outline, #5, spikes hard on aroma but pulls in on yield. Now the decision is visual. If you weight overall balance and yield, #3 is your keeper. If you were hunting purely for the loudest nose and nothing else, #5 makes a case. The chart does not decide for you. It makes the trade-off impossible to miss.
Seeing the whole hunt at once
Two plants at a time is great for a final call, but early on you want the whole batch. That is what the Hunt scorecard heatmap is for. Every pheno sits in a row, every trait in a column, and each cell is colored by its score. Cells above seven glow green, the middle band sits amber, and anything below four goes red, so the pattern jumps out before you read a single number.
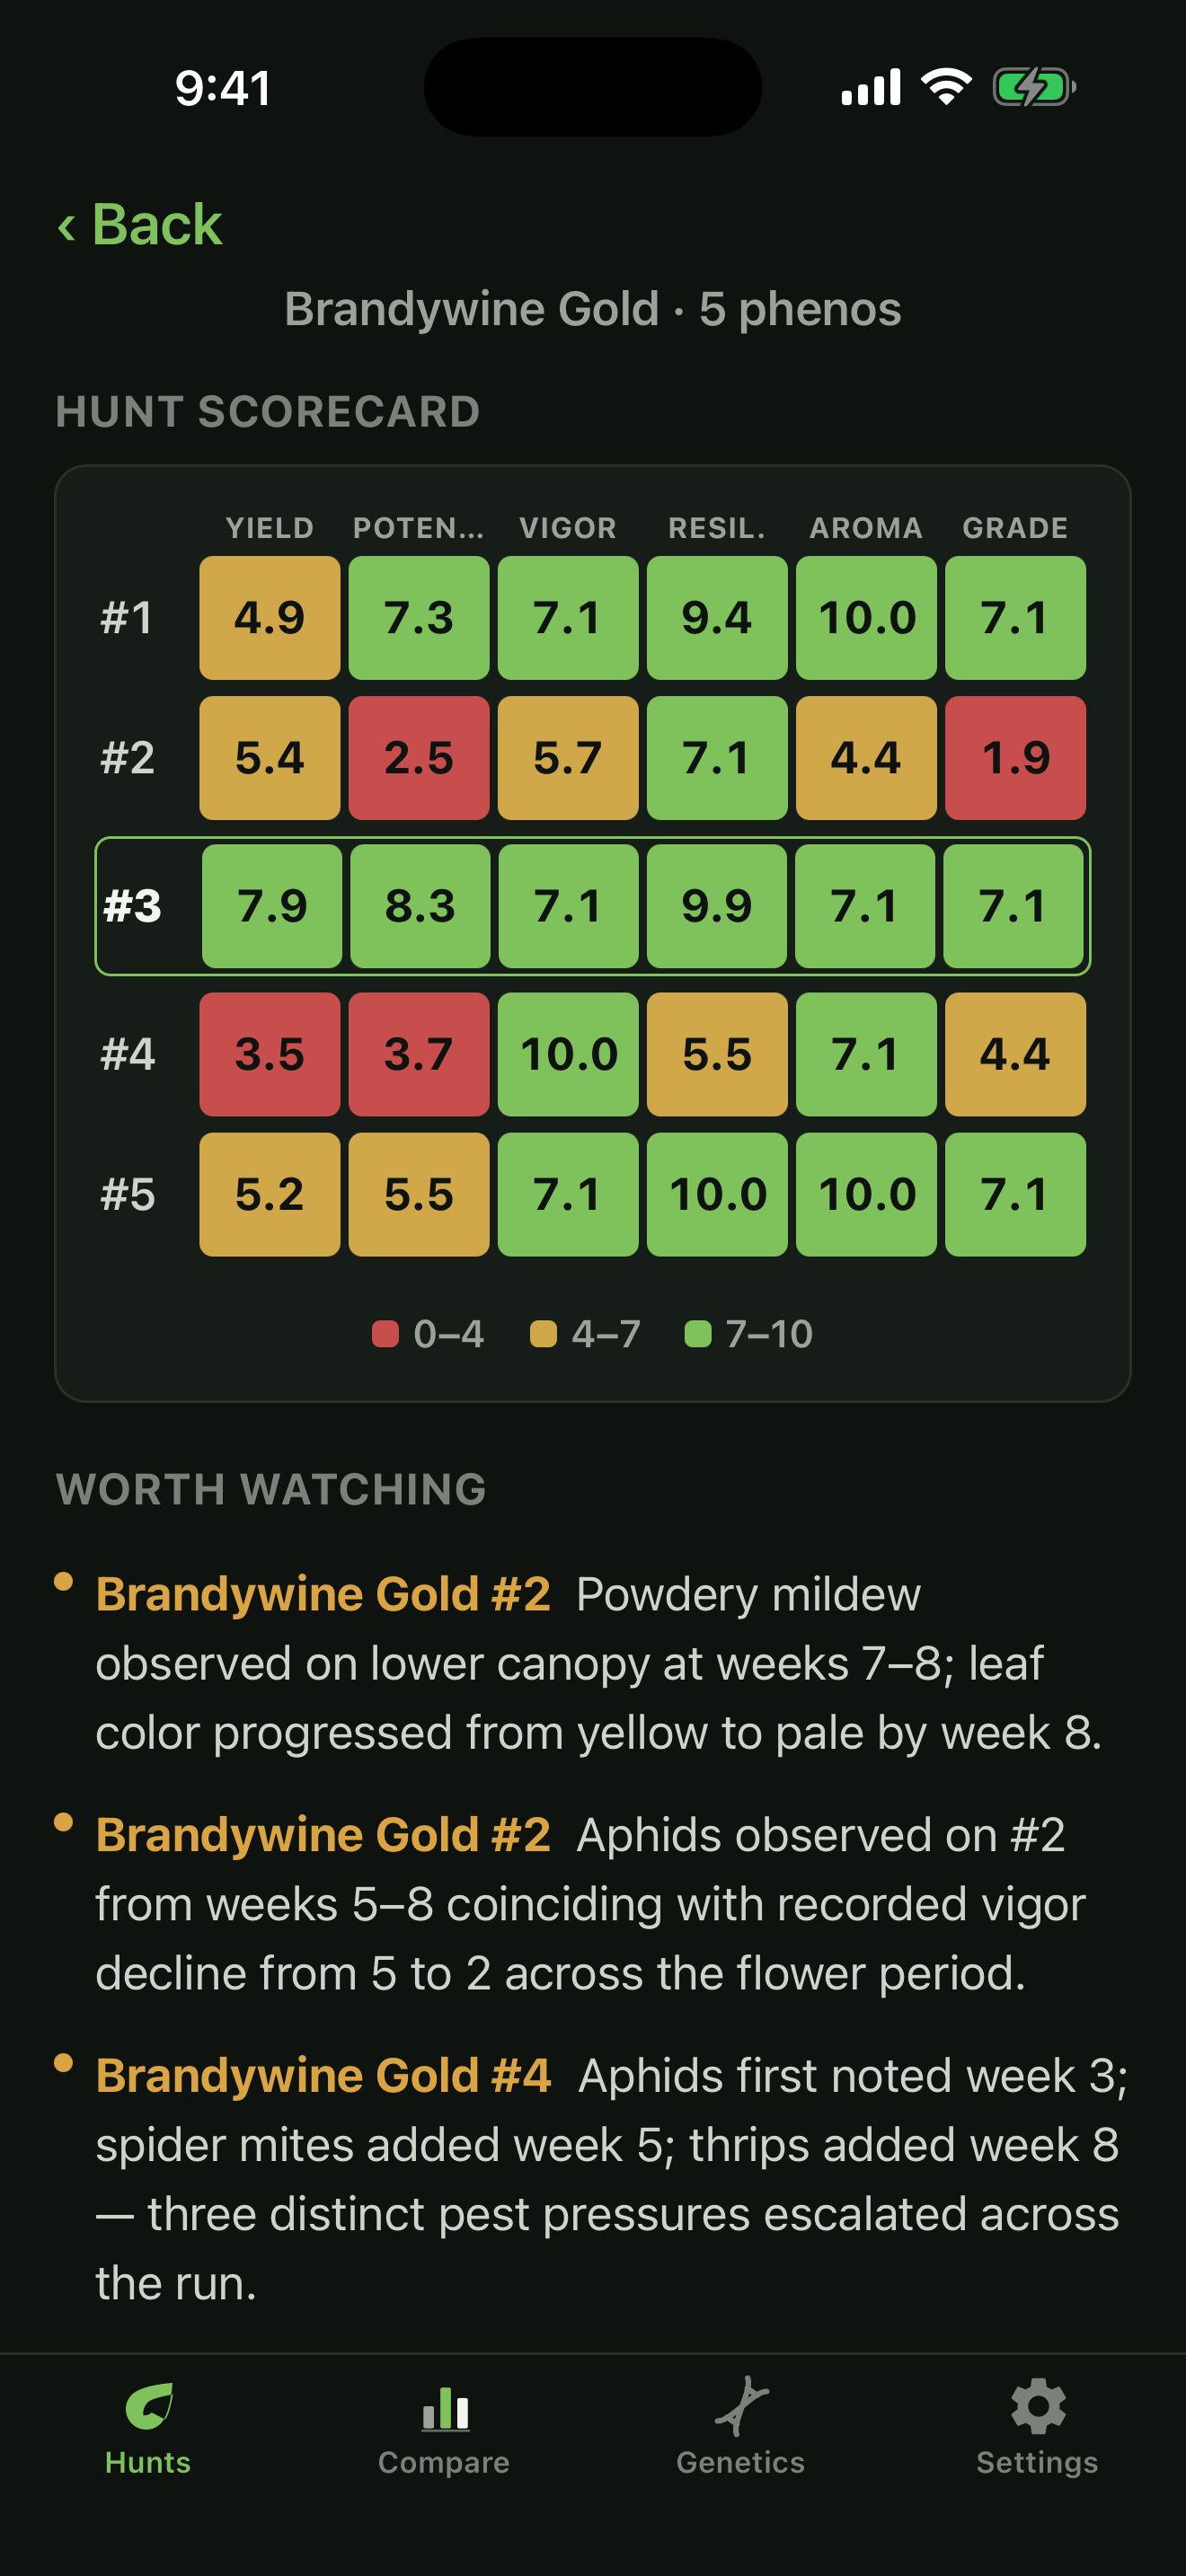
Scanning a heatmap is how you narrow fifteen phenos down to the three worth putting on the radar. Look for the row that stays green across the most columns. Look for the columns where the whole batch is weak, which tells you something about the cultivar, not just the plant.
Where the keeper pulls ahead
The last view answers a specific question: not just which plant is best overall, but exactly where it separates from the pack. The standout view, labeled How the keeper stands out, plots every pheno trait by trait, each on its own lane, with the keeper marked larger, so you can see the gap.
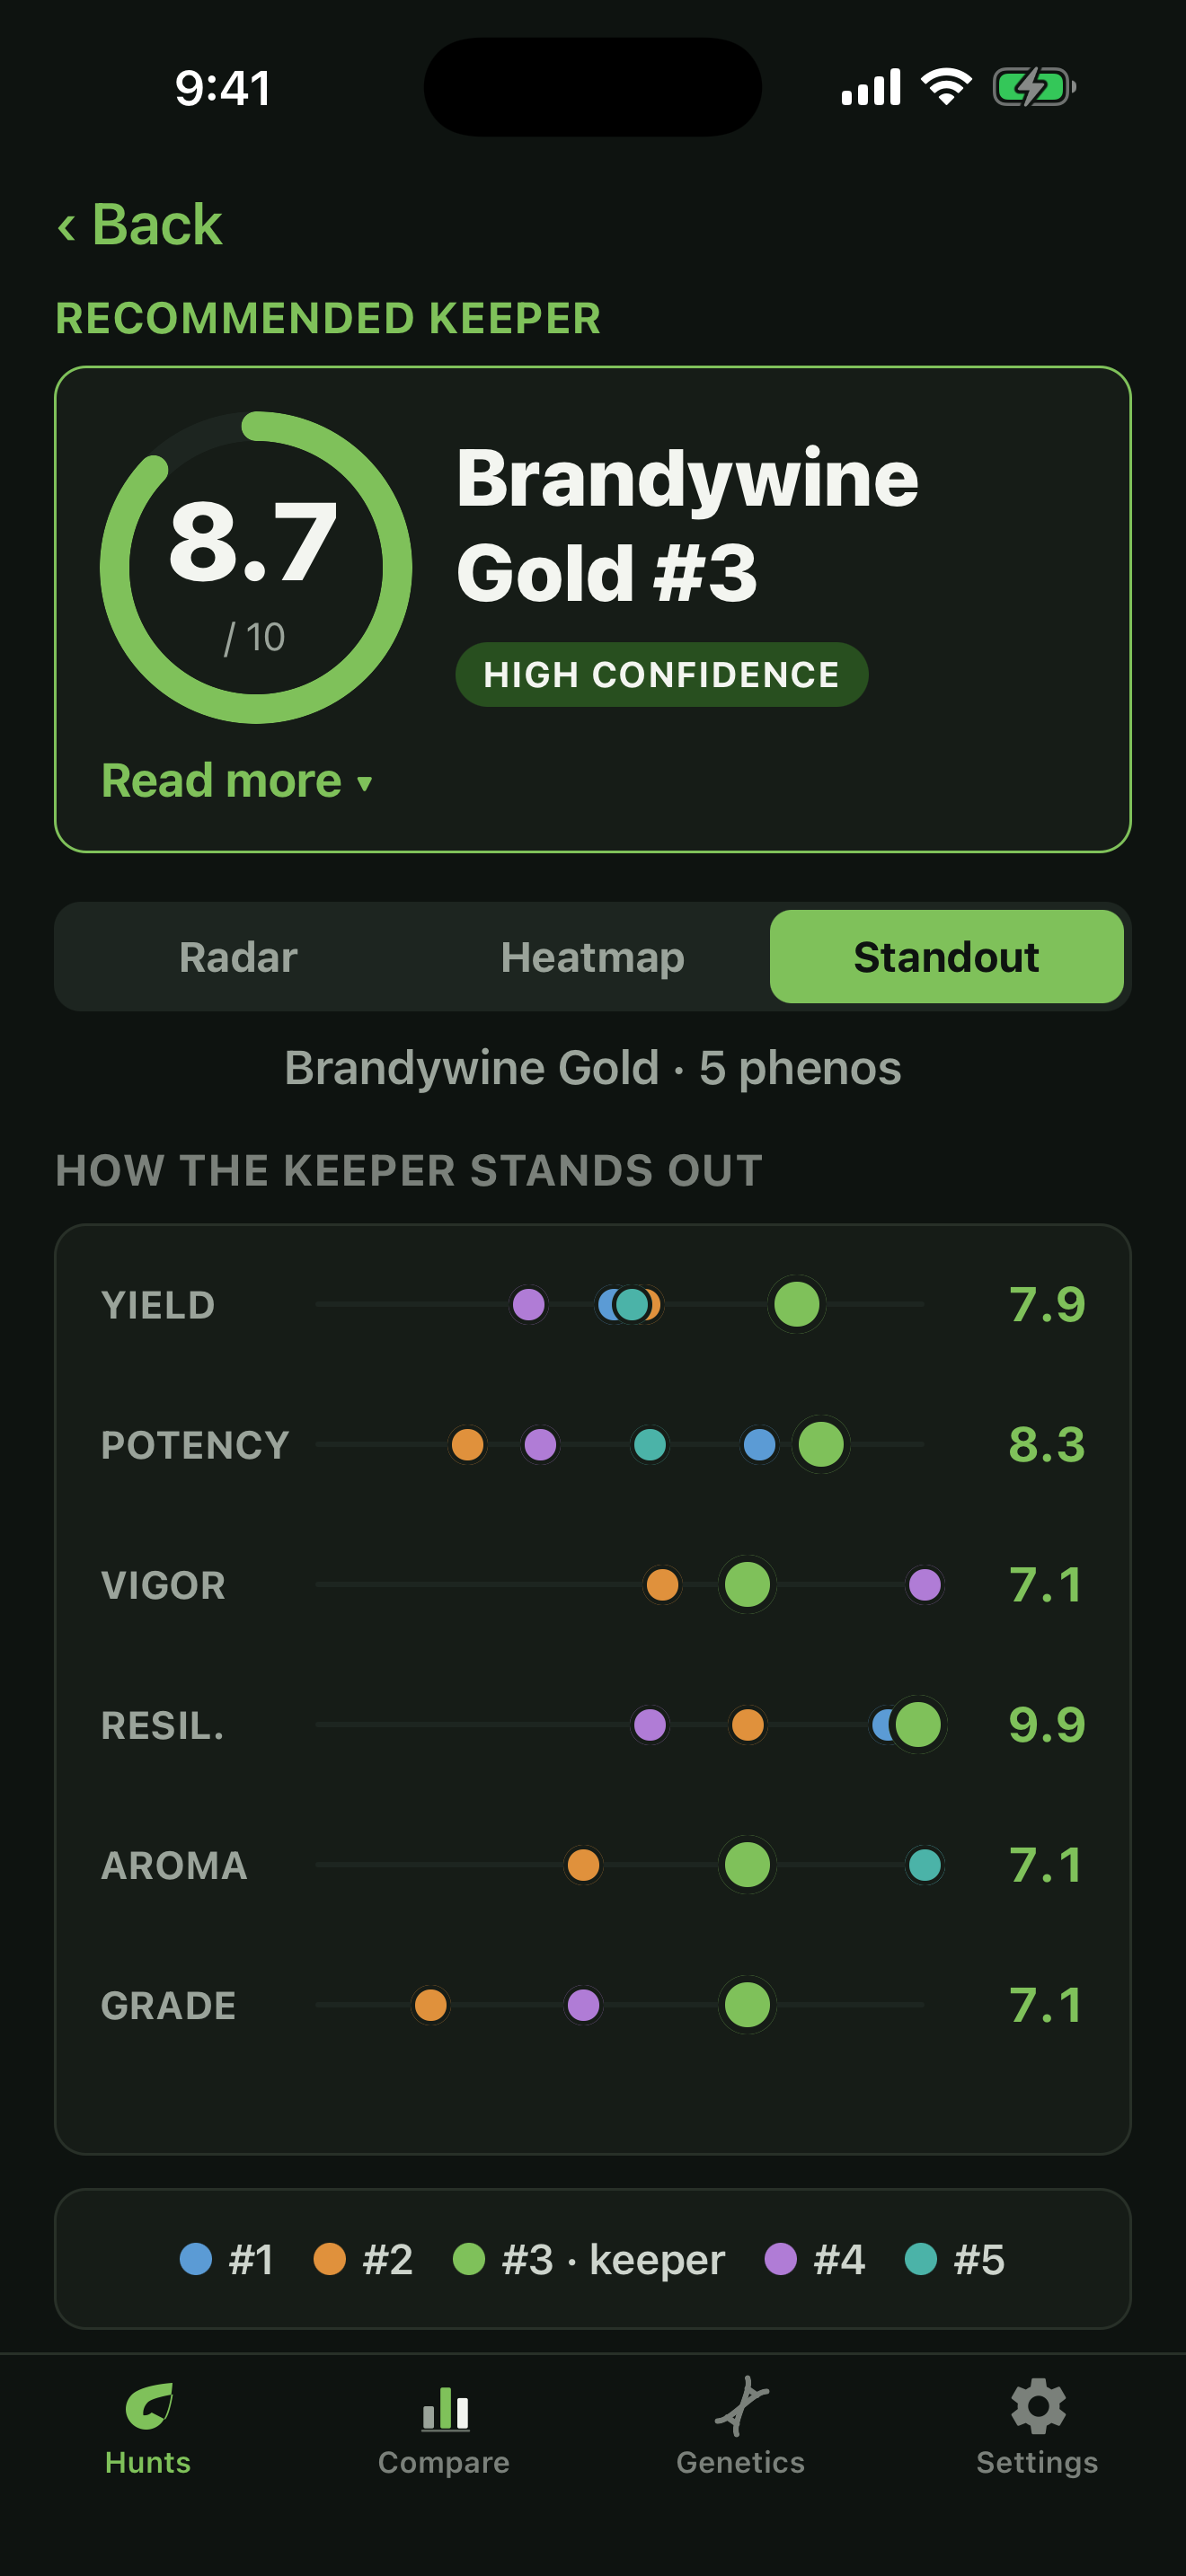
This is the view that turns a keeper call into a story you can tell. Brandywine Gold #3 is not just “the best one.” It is the plant that sits at the top of the yield lane and the resilience lane while staying near the top on aroma. That is a defensible keeper, and it took about three seconds to see.
The takeaway
Numbers prove a result. A chart reveals it. Read a single radar for a plant’s personality, overlay two to see the trade-off, scan the heatmap to narrow the field, and use the standout lanes to see where your keeper separates. Once you are used to reading shapes instead of columns, picking a keeper stops feeling like an argument and starts feeling obvious.
Find your keeper.
PhenoLog keeps every pheno, score, and observation in one place and lines them up, so the standout is easy to see. Free to start.
Get it on the App Store